
Case Study:
Japanese Knotweed
Push button, map invasives.
Japanese Knotweed arrived in Maine more than a century ago as an ornamental import, but its resilience has turned it into a major ecological threat. Heavy rain events can fragment its root system, sending live pieces downstream through culverts and storm drains. Along trout streams and riparian corridors, these fragments take root, choke out native vegetation, destabilize soil banks and increase erosion, leading to higher sediment loads and poorer water quality downstream.
What begins as a single patch can, within a few seasons, dominate miles of riverbank.
Naughtweed treats this not just as an ecological problem, but as an educational + coordination design challenge. By connecting ground truth data with citizen science learners, we convert stormwater-driven spread into mappable data - the foundation for rapid, targeted response. Each verified observation builds the shared intelligence needed for early detection and restoration, while also unlocking real economic value through paid fieldwork and partner brand rewards. Every data point becomes both an environmental action and a micro-transaction in a new freelance restoration economy.
The following interactive maps show road-side Japanese Knotweed infestations across Maine - over 4,000 observations by one person in 21 days. These observations were collected passively while driving (i.e., not during any planned field surveys) using a single physical button press.
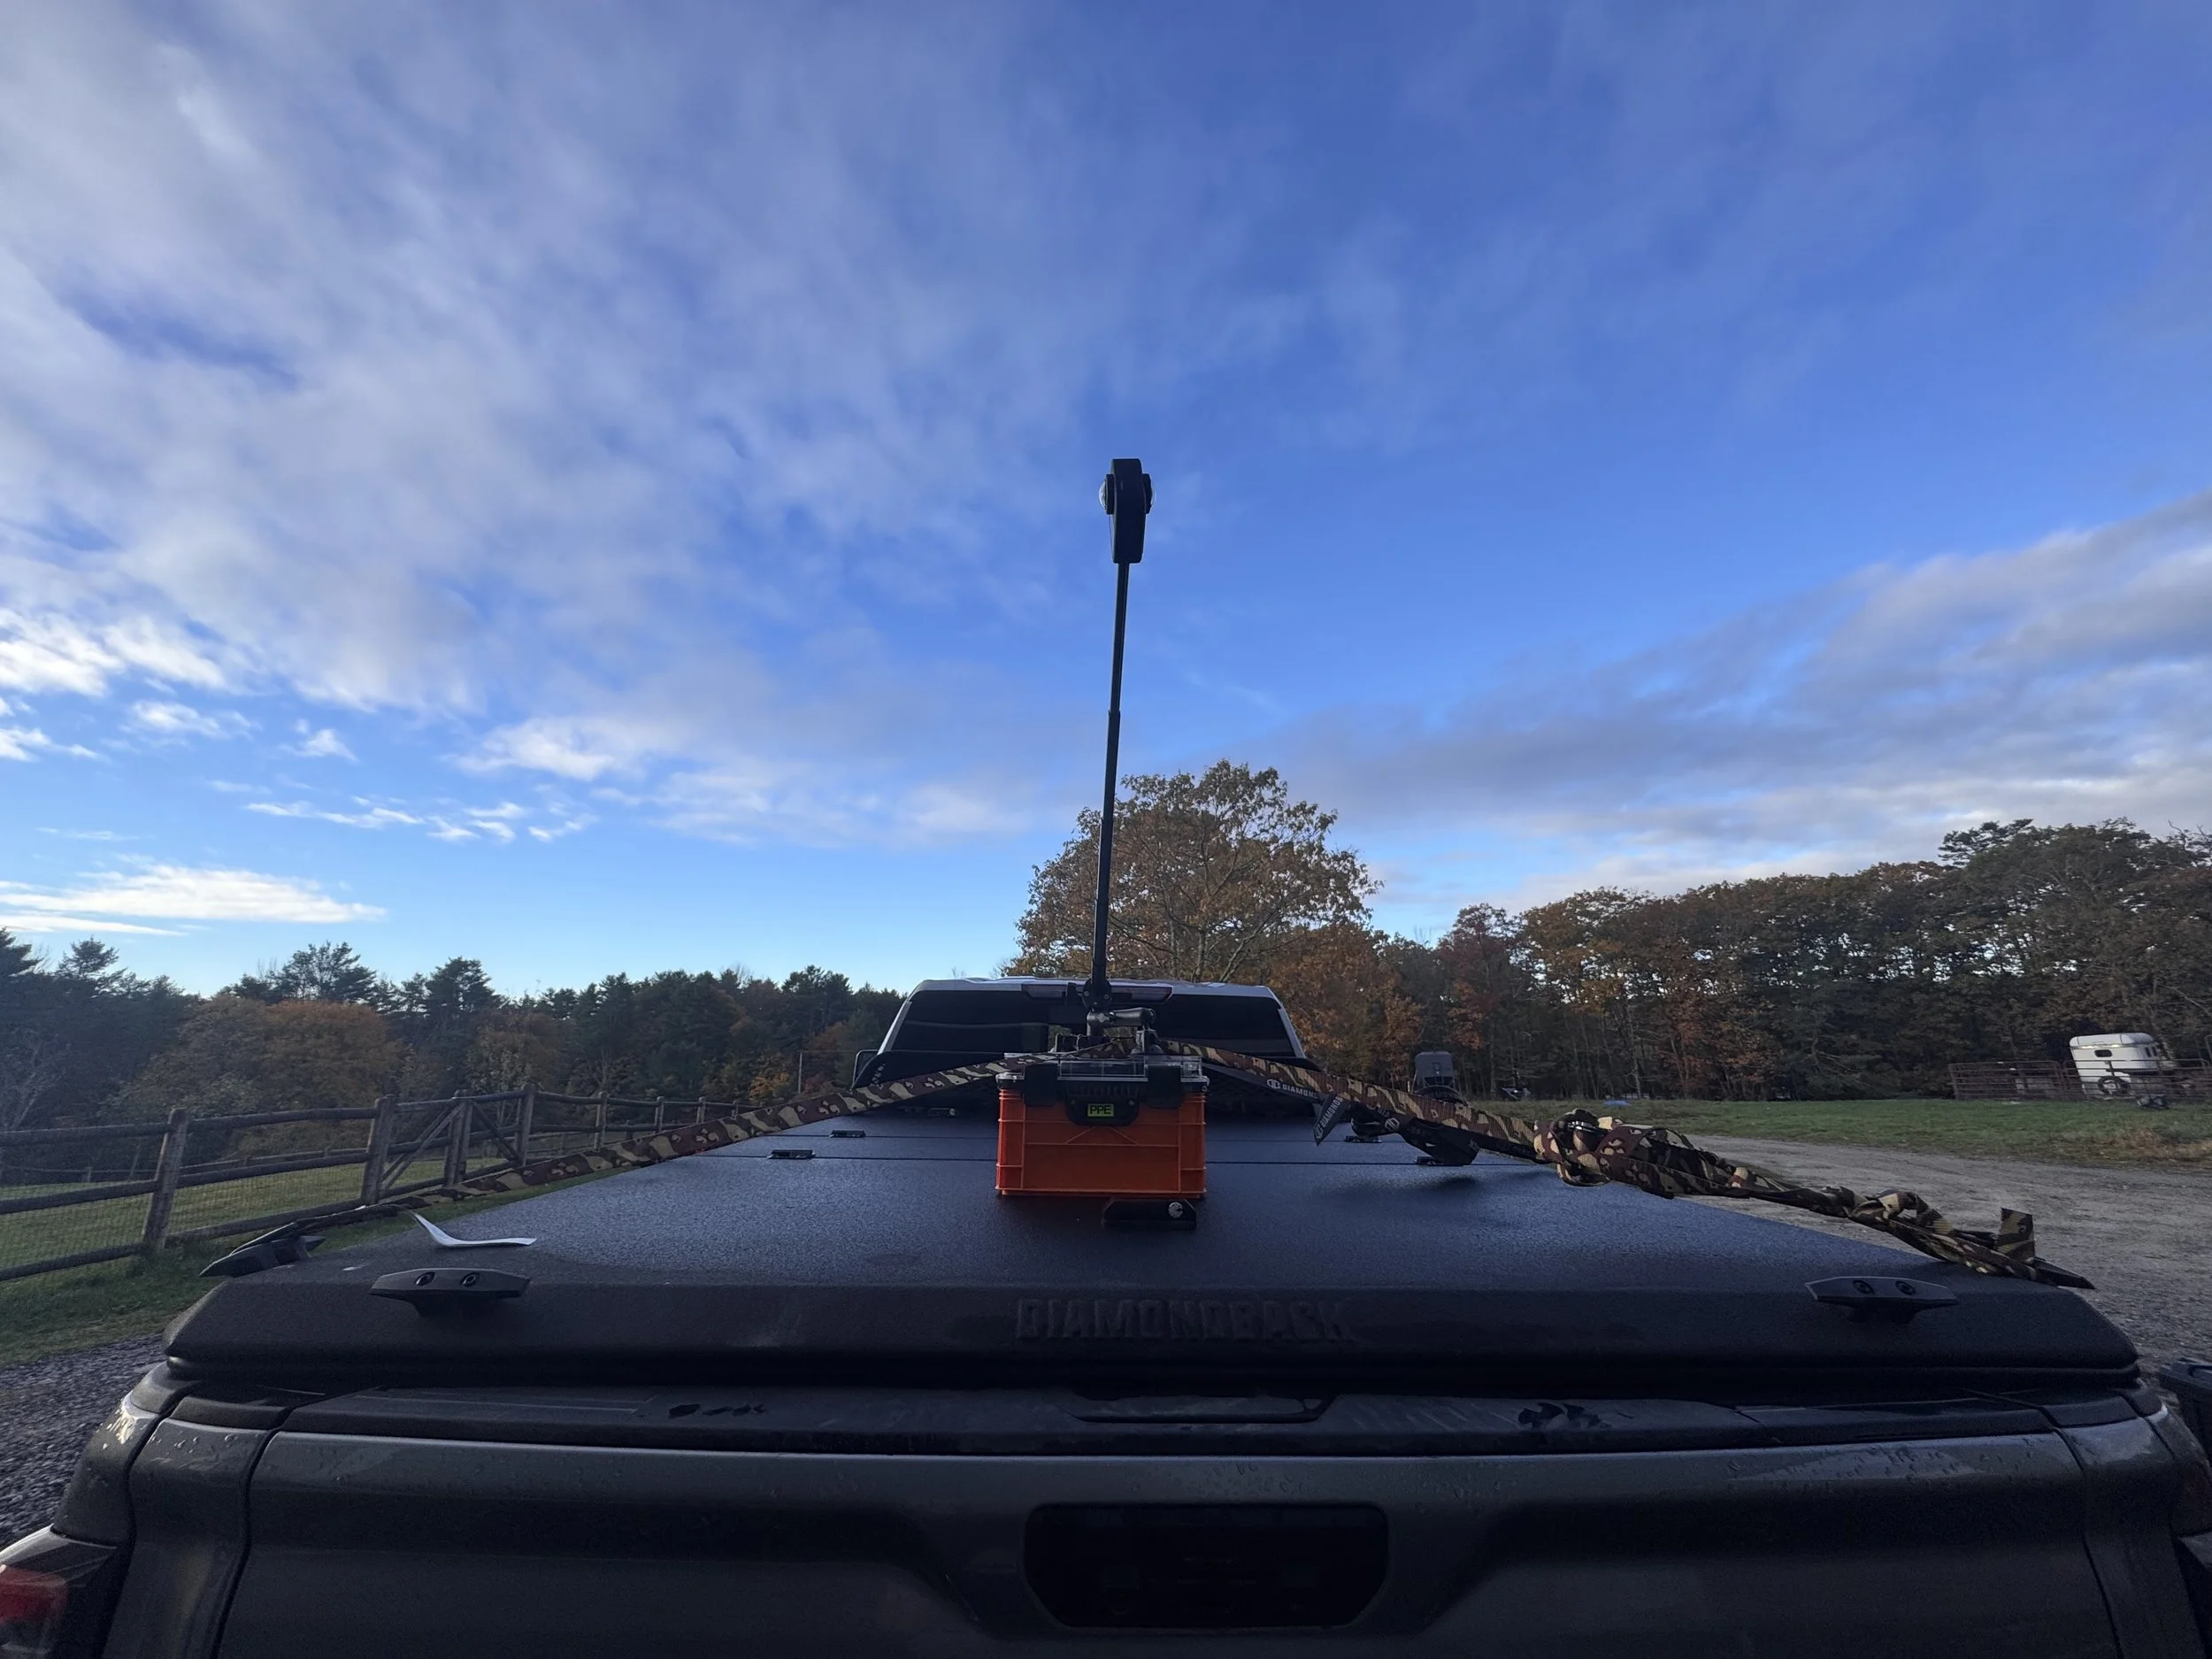
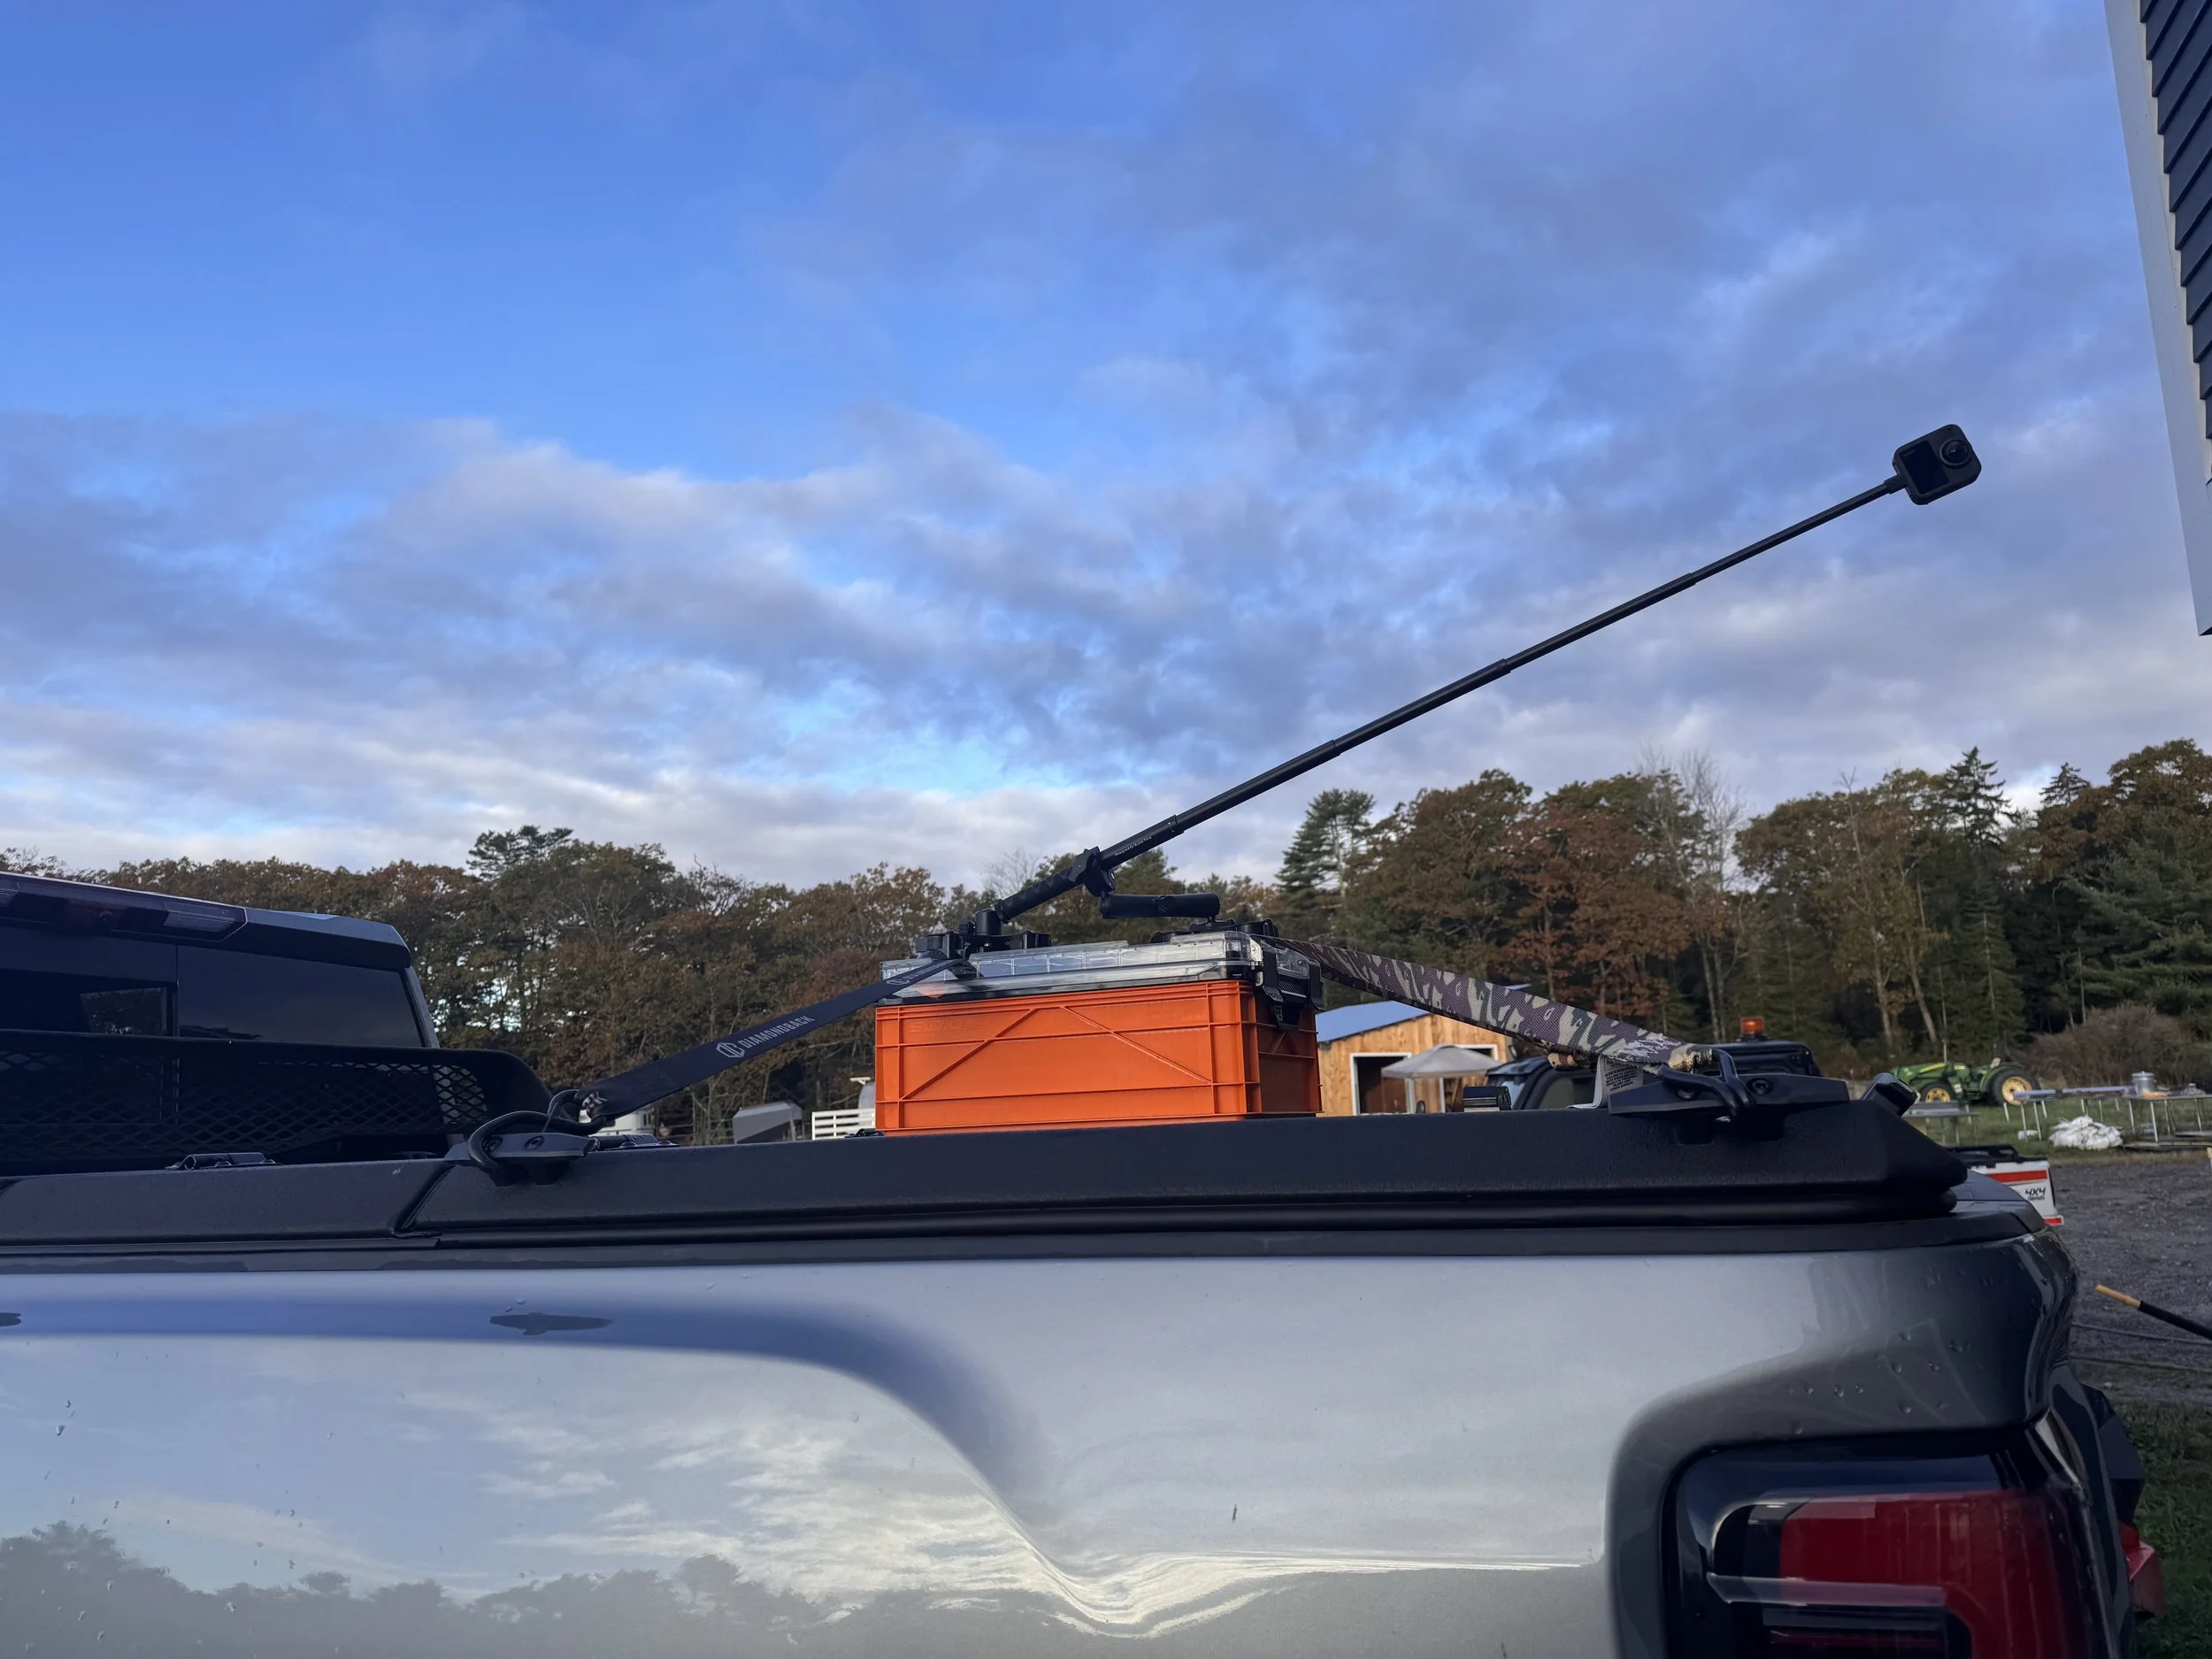
This inexpensive button is mounted temporarily on a vehicle dash; every press adds phone location data, which is then parsed into a map-ready format for early detection visualization. Higher opacity indicates higher observation density, helping Naughtweed members identify hotspots before the next storm. This simple workflow unfolds in three steps:
Map – Visible infestations are logged with a single button press.
Heatmap – Observations are aggregated into live intensity layers, guiding intervention in highest risk areas.
Google Street View – Interactive imagery validates coordinate data, confirming treatment needs and supporting mitigation strategies.
Together, these tools demonstrate how rapid, low-cost observation methods can turn a widespread invasive threat into a coordinated, data-driven restoration effort - one that pays local people to protect lands and local waters.
Step 1: Single button press logs invasive location data.
Step 2: Apply heatmap triage layer (scroll to dive in)
Images at left shows raw 360 imagery, while images at right show bounding boxes detecting roadside Japanese Knotweed.
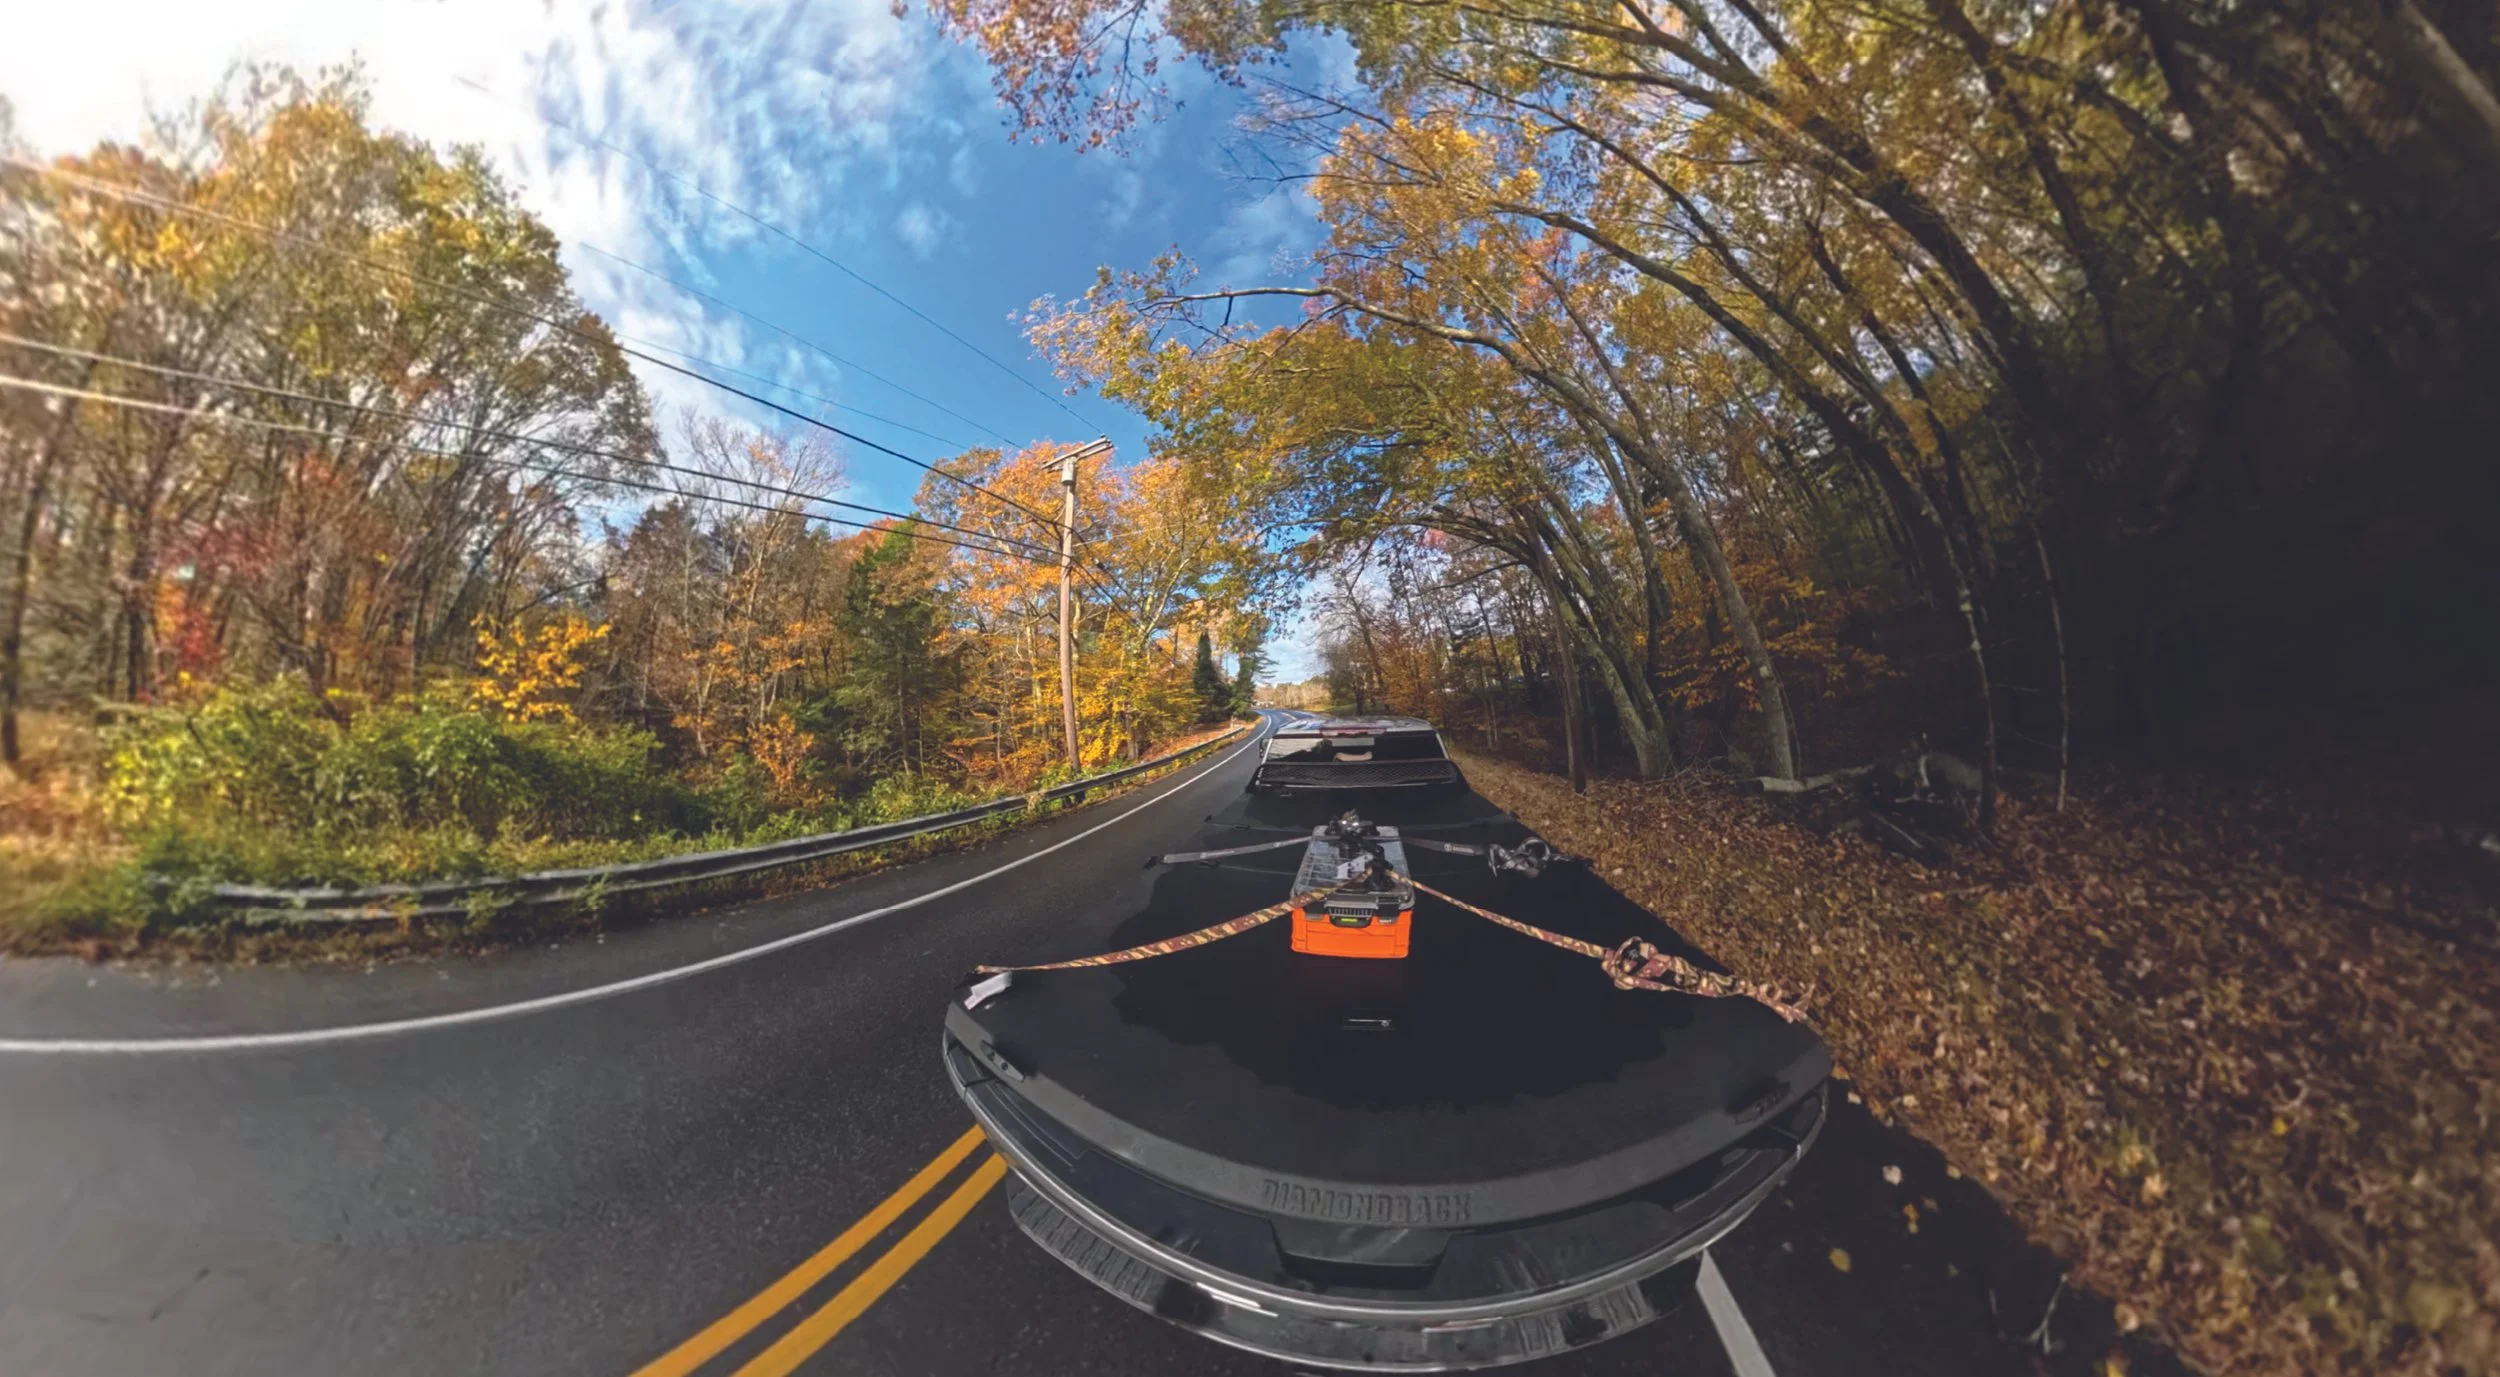
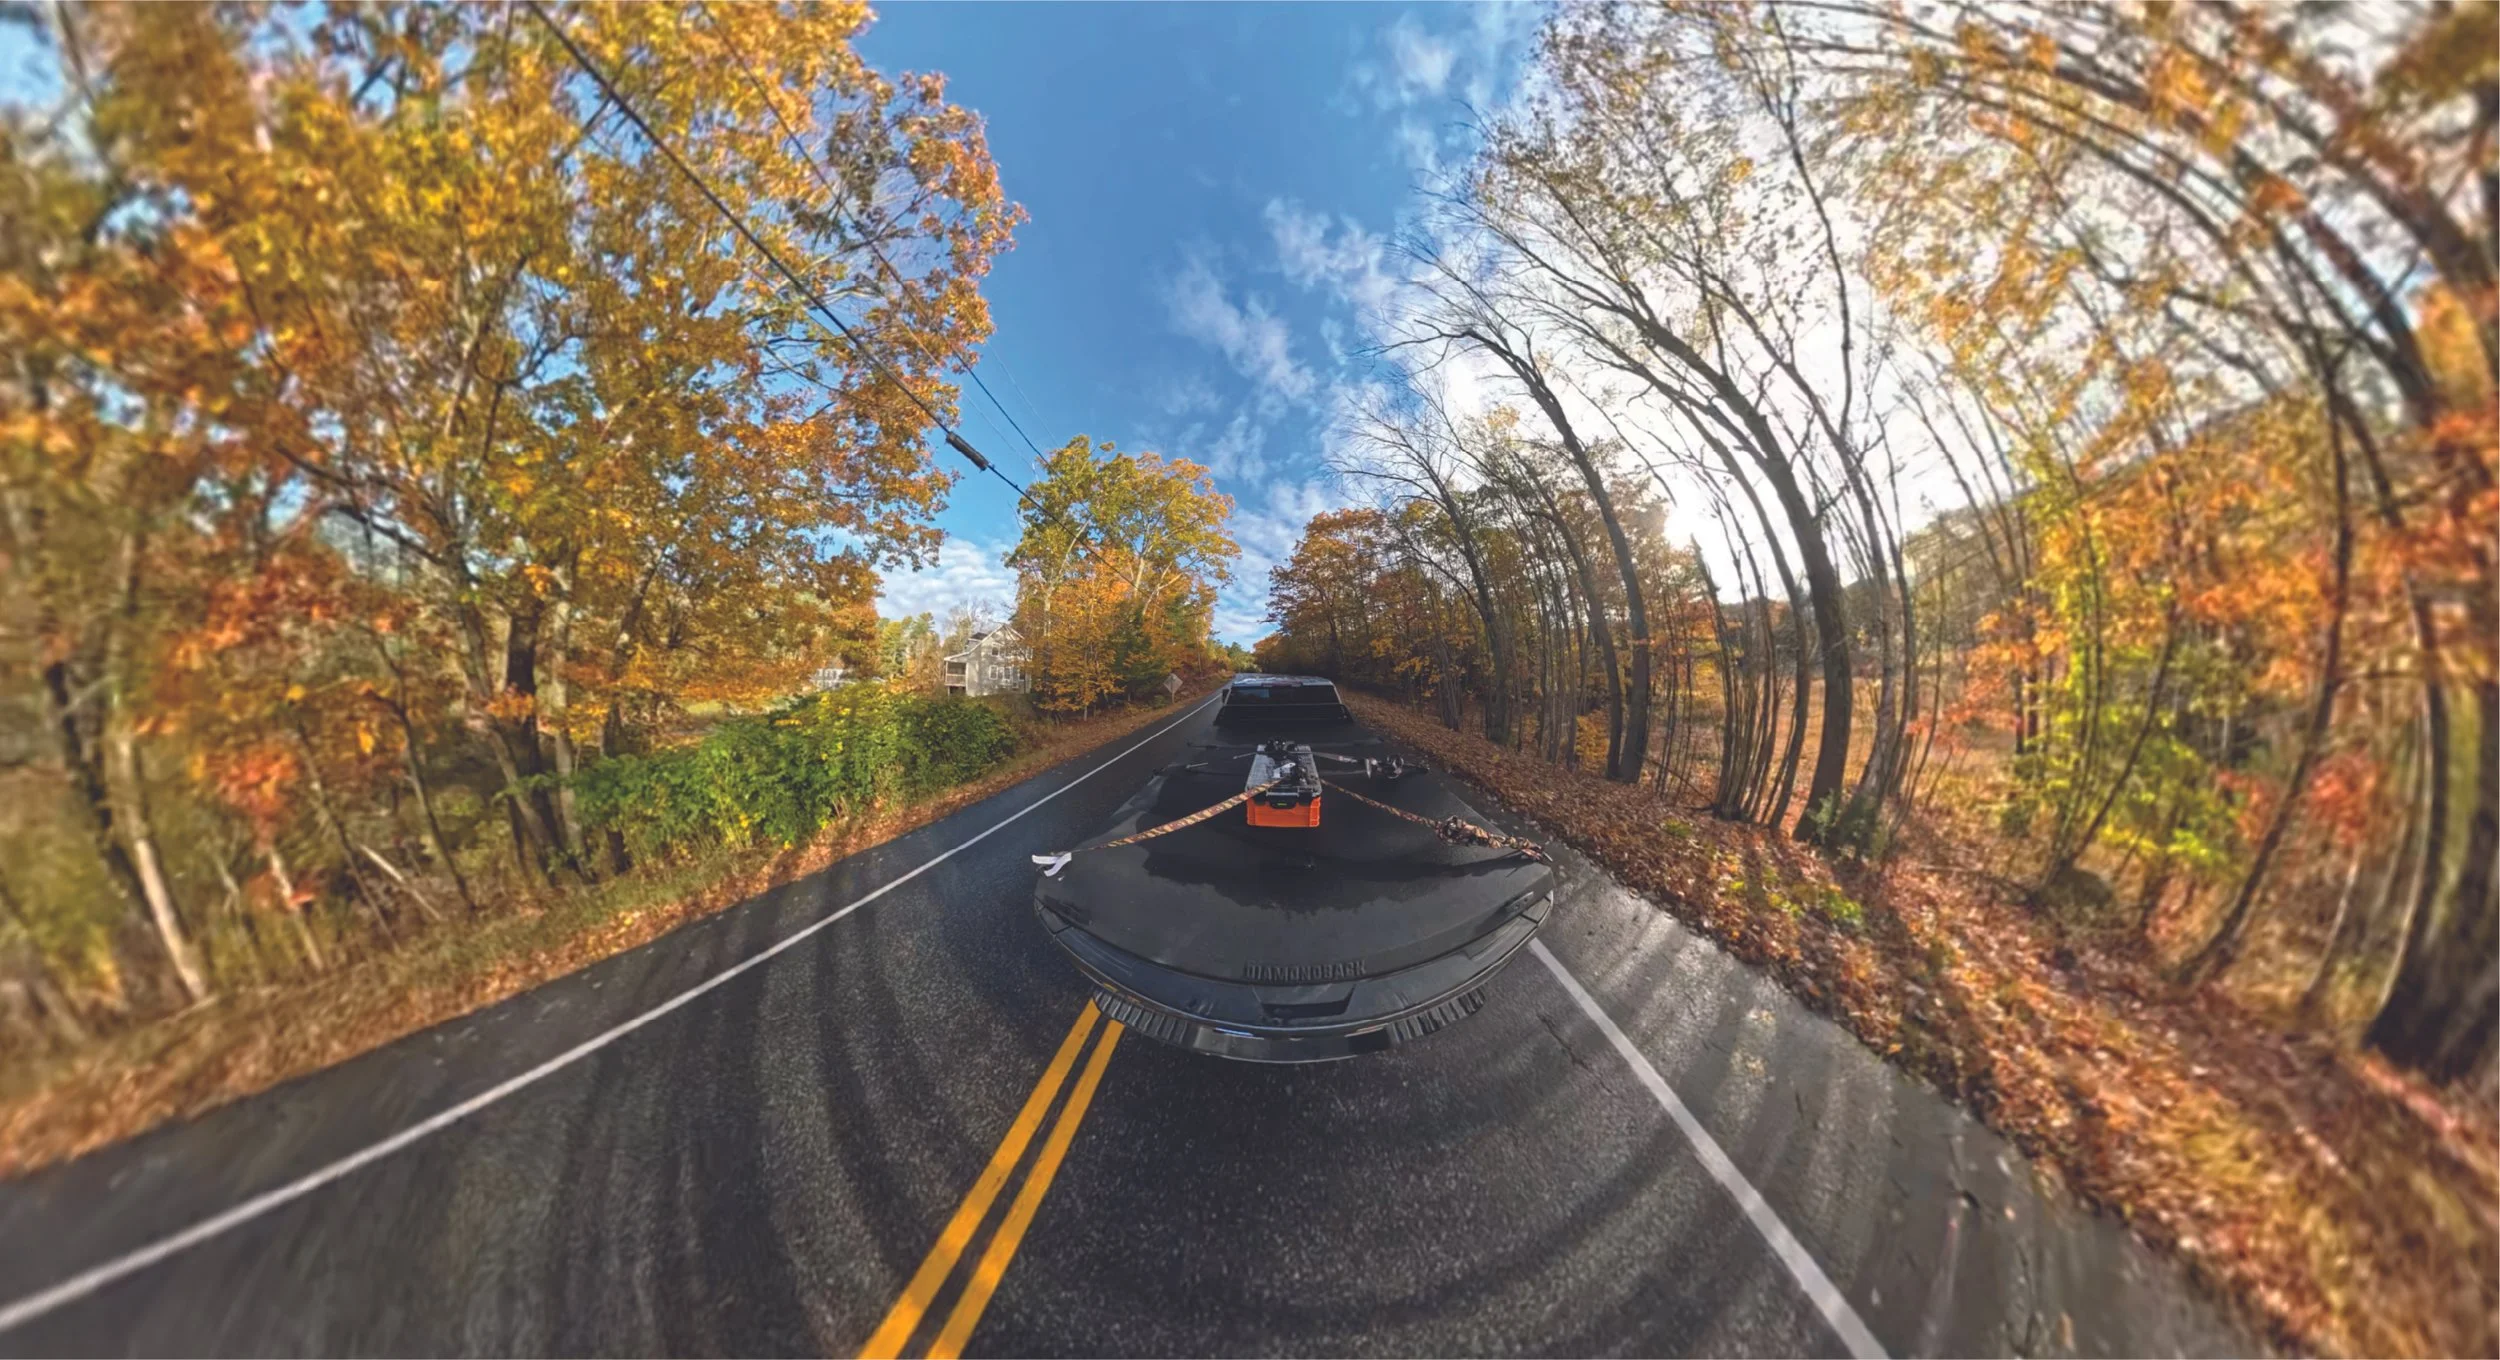
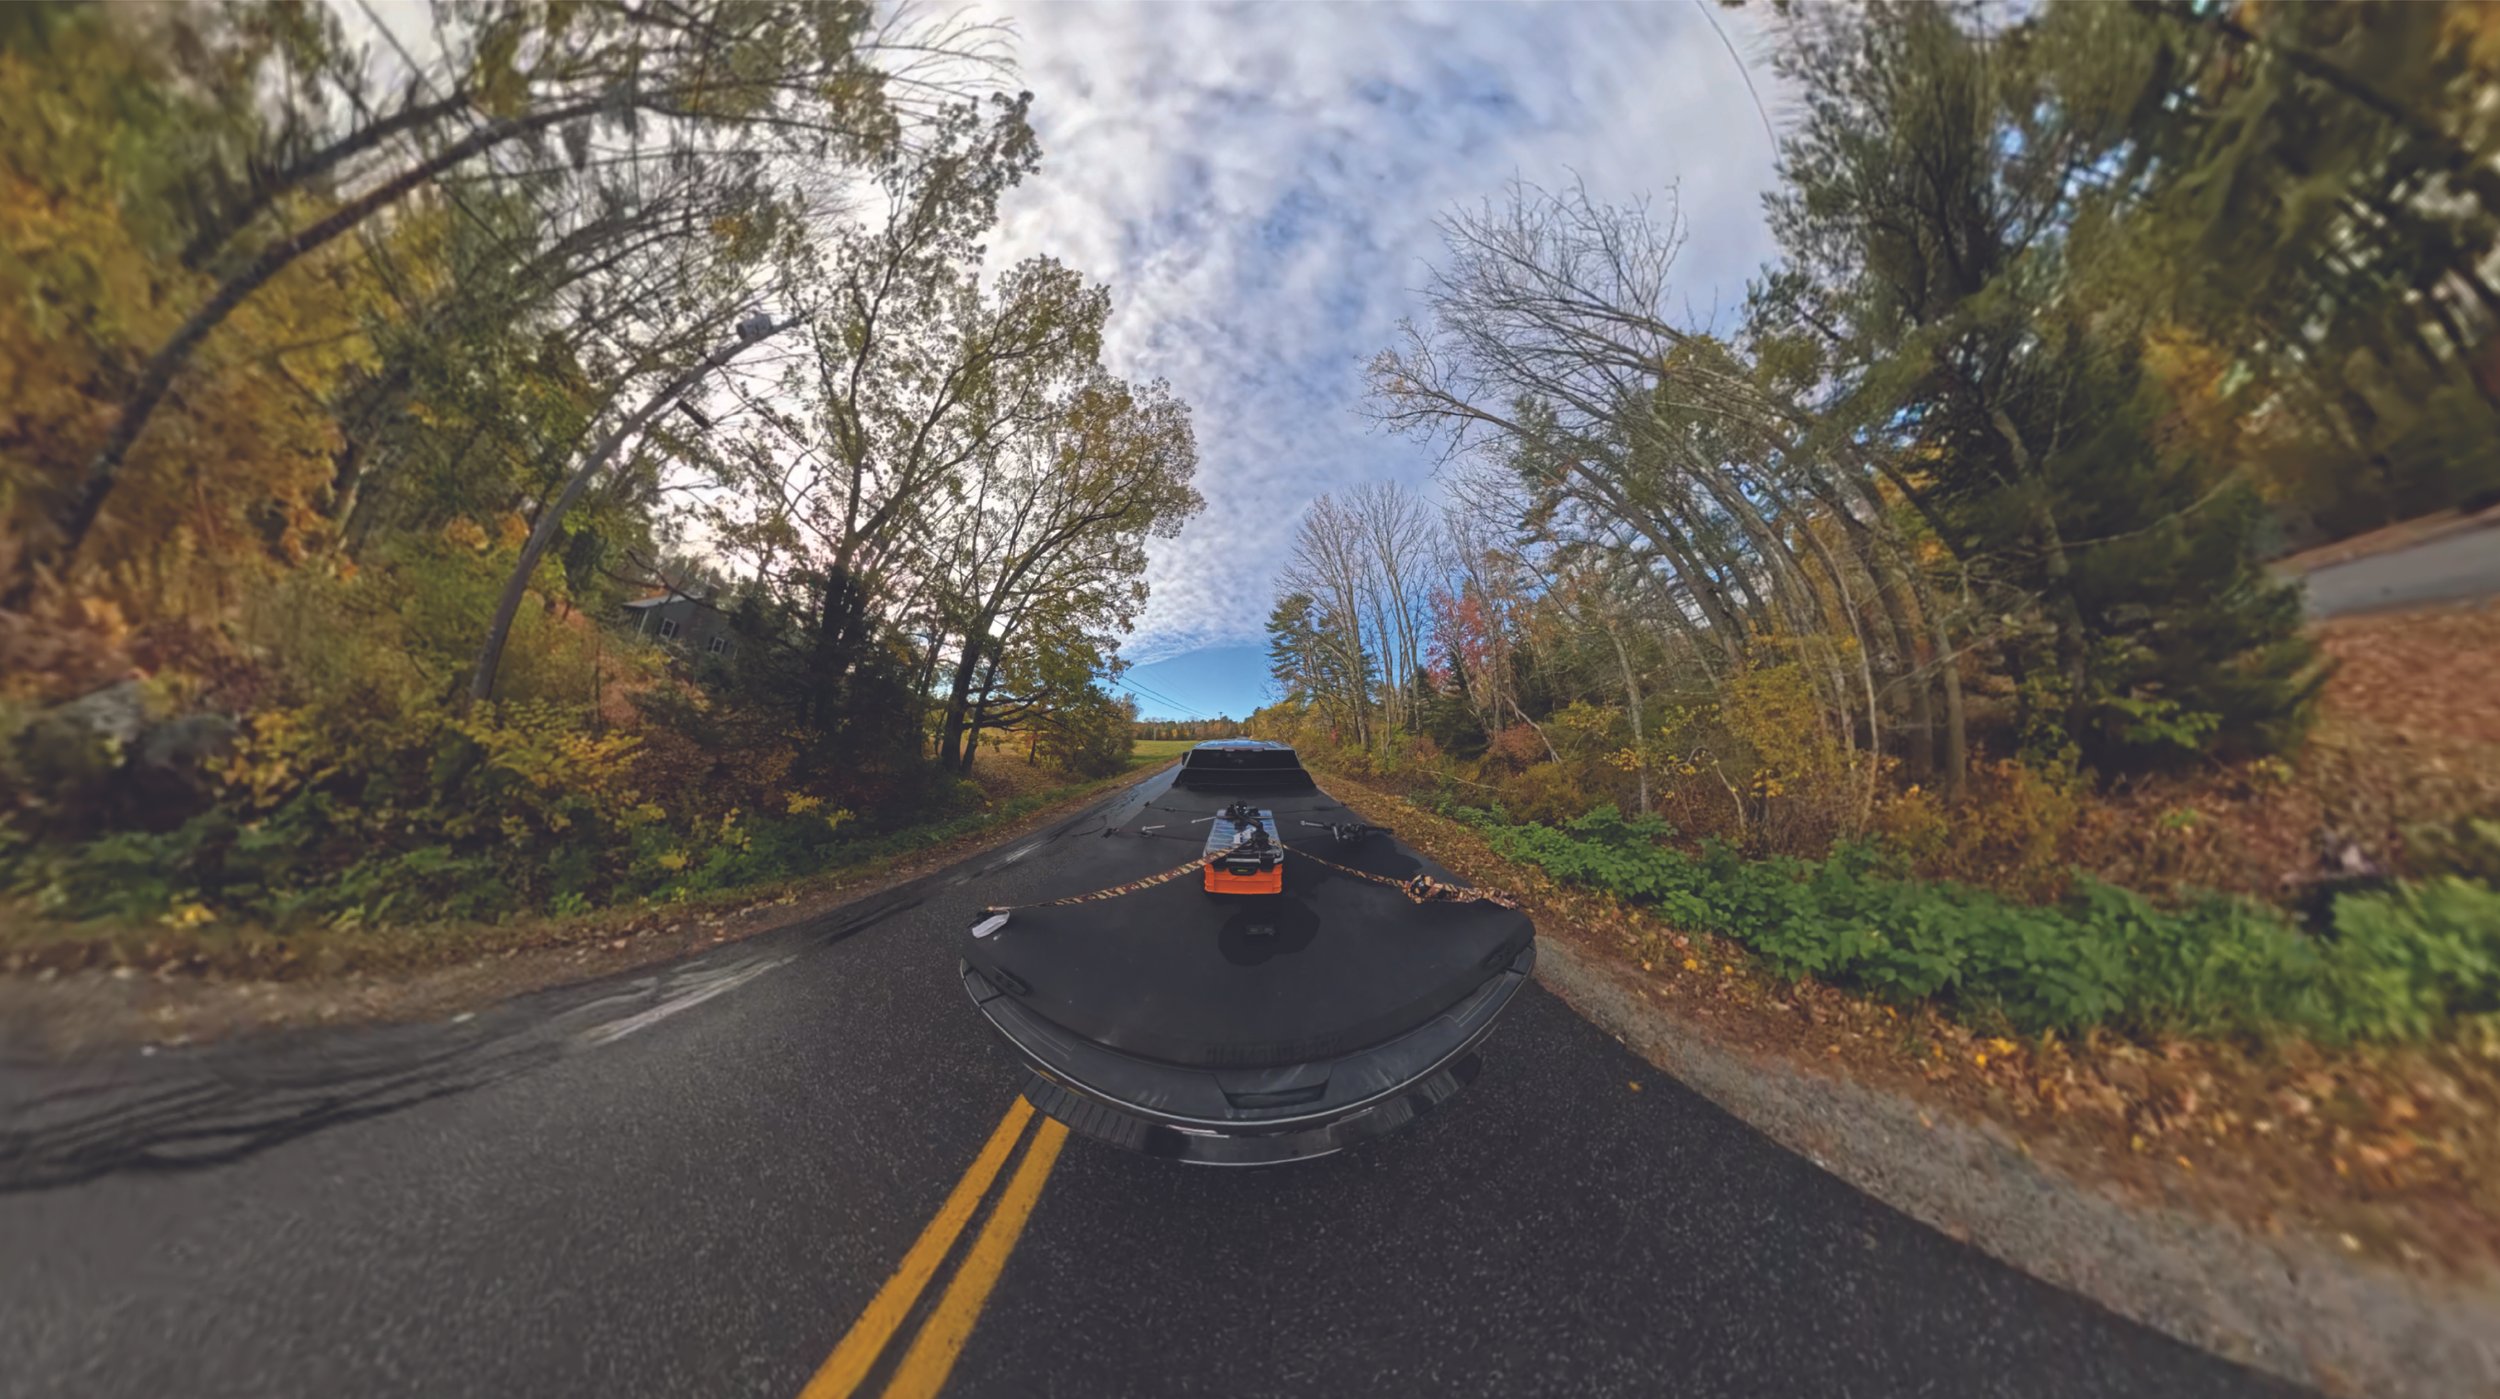
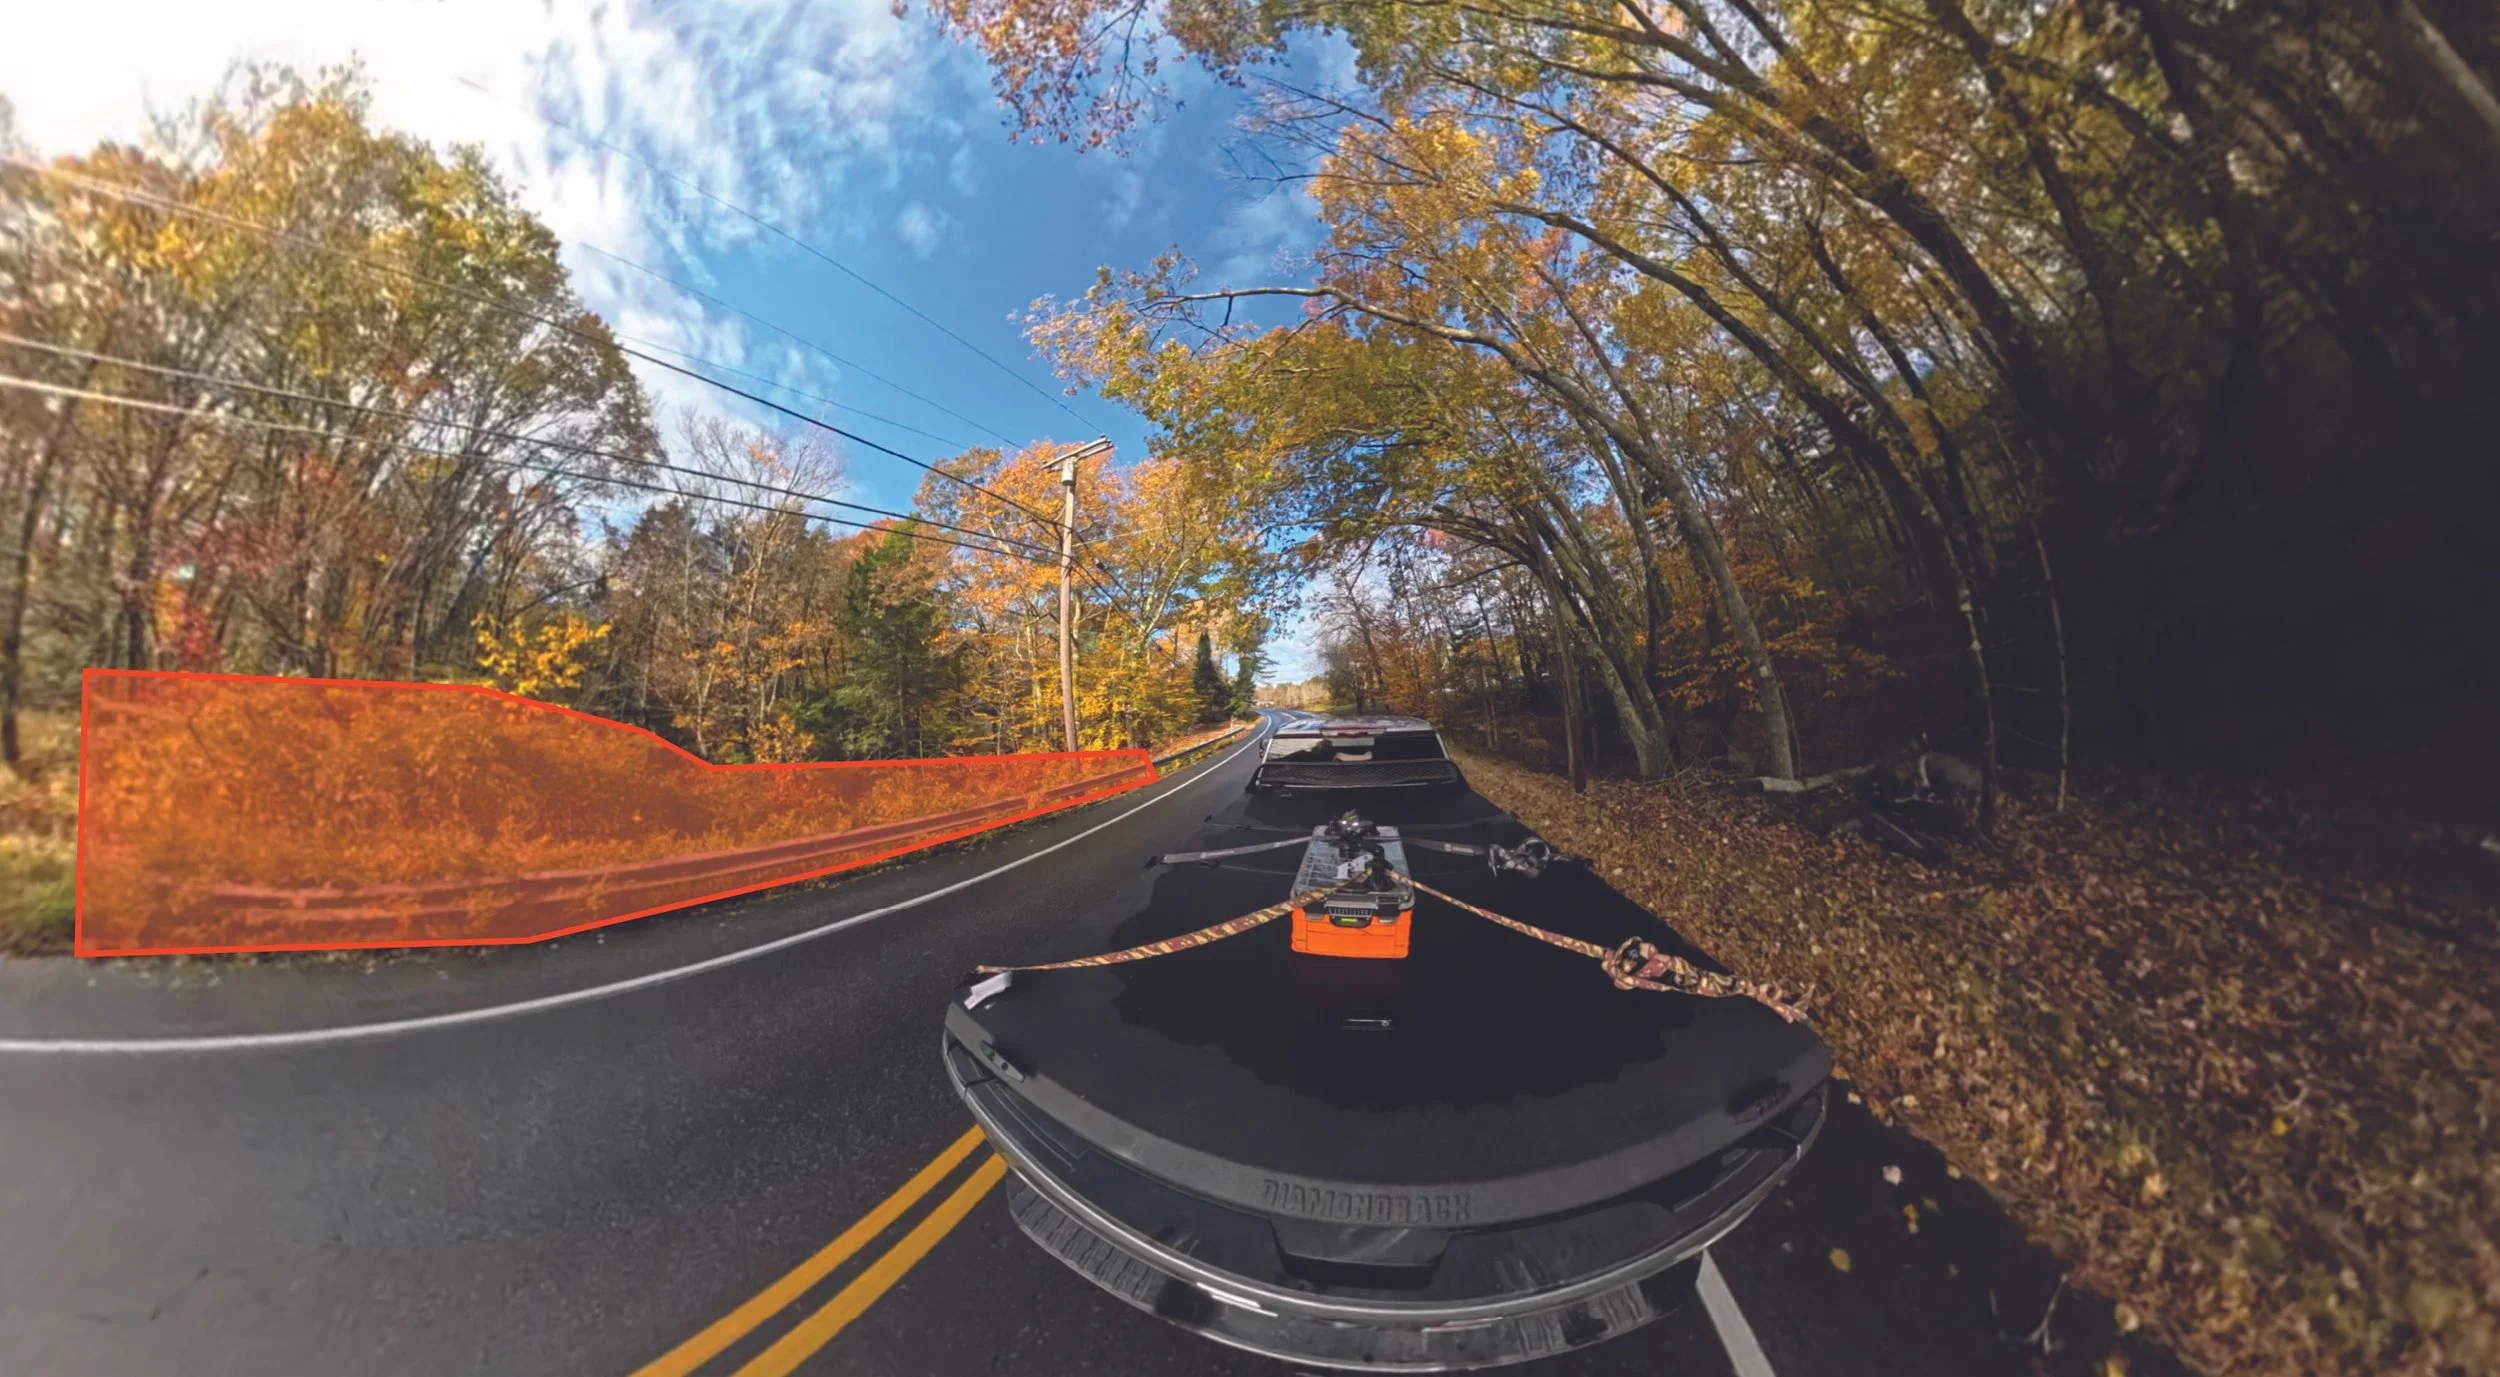
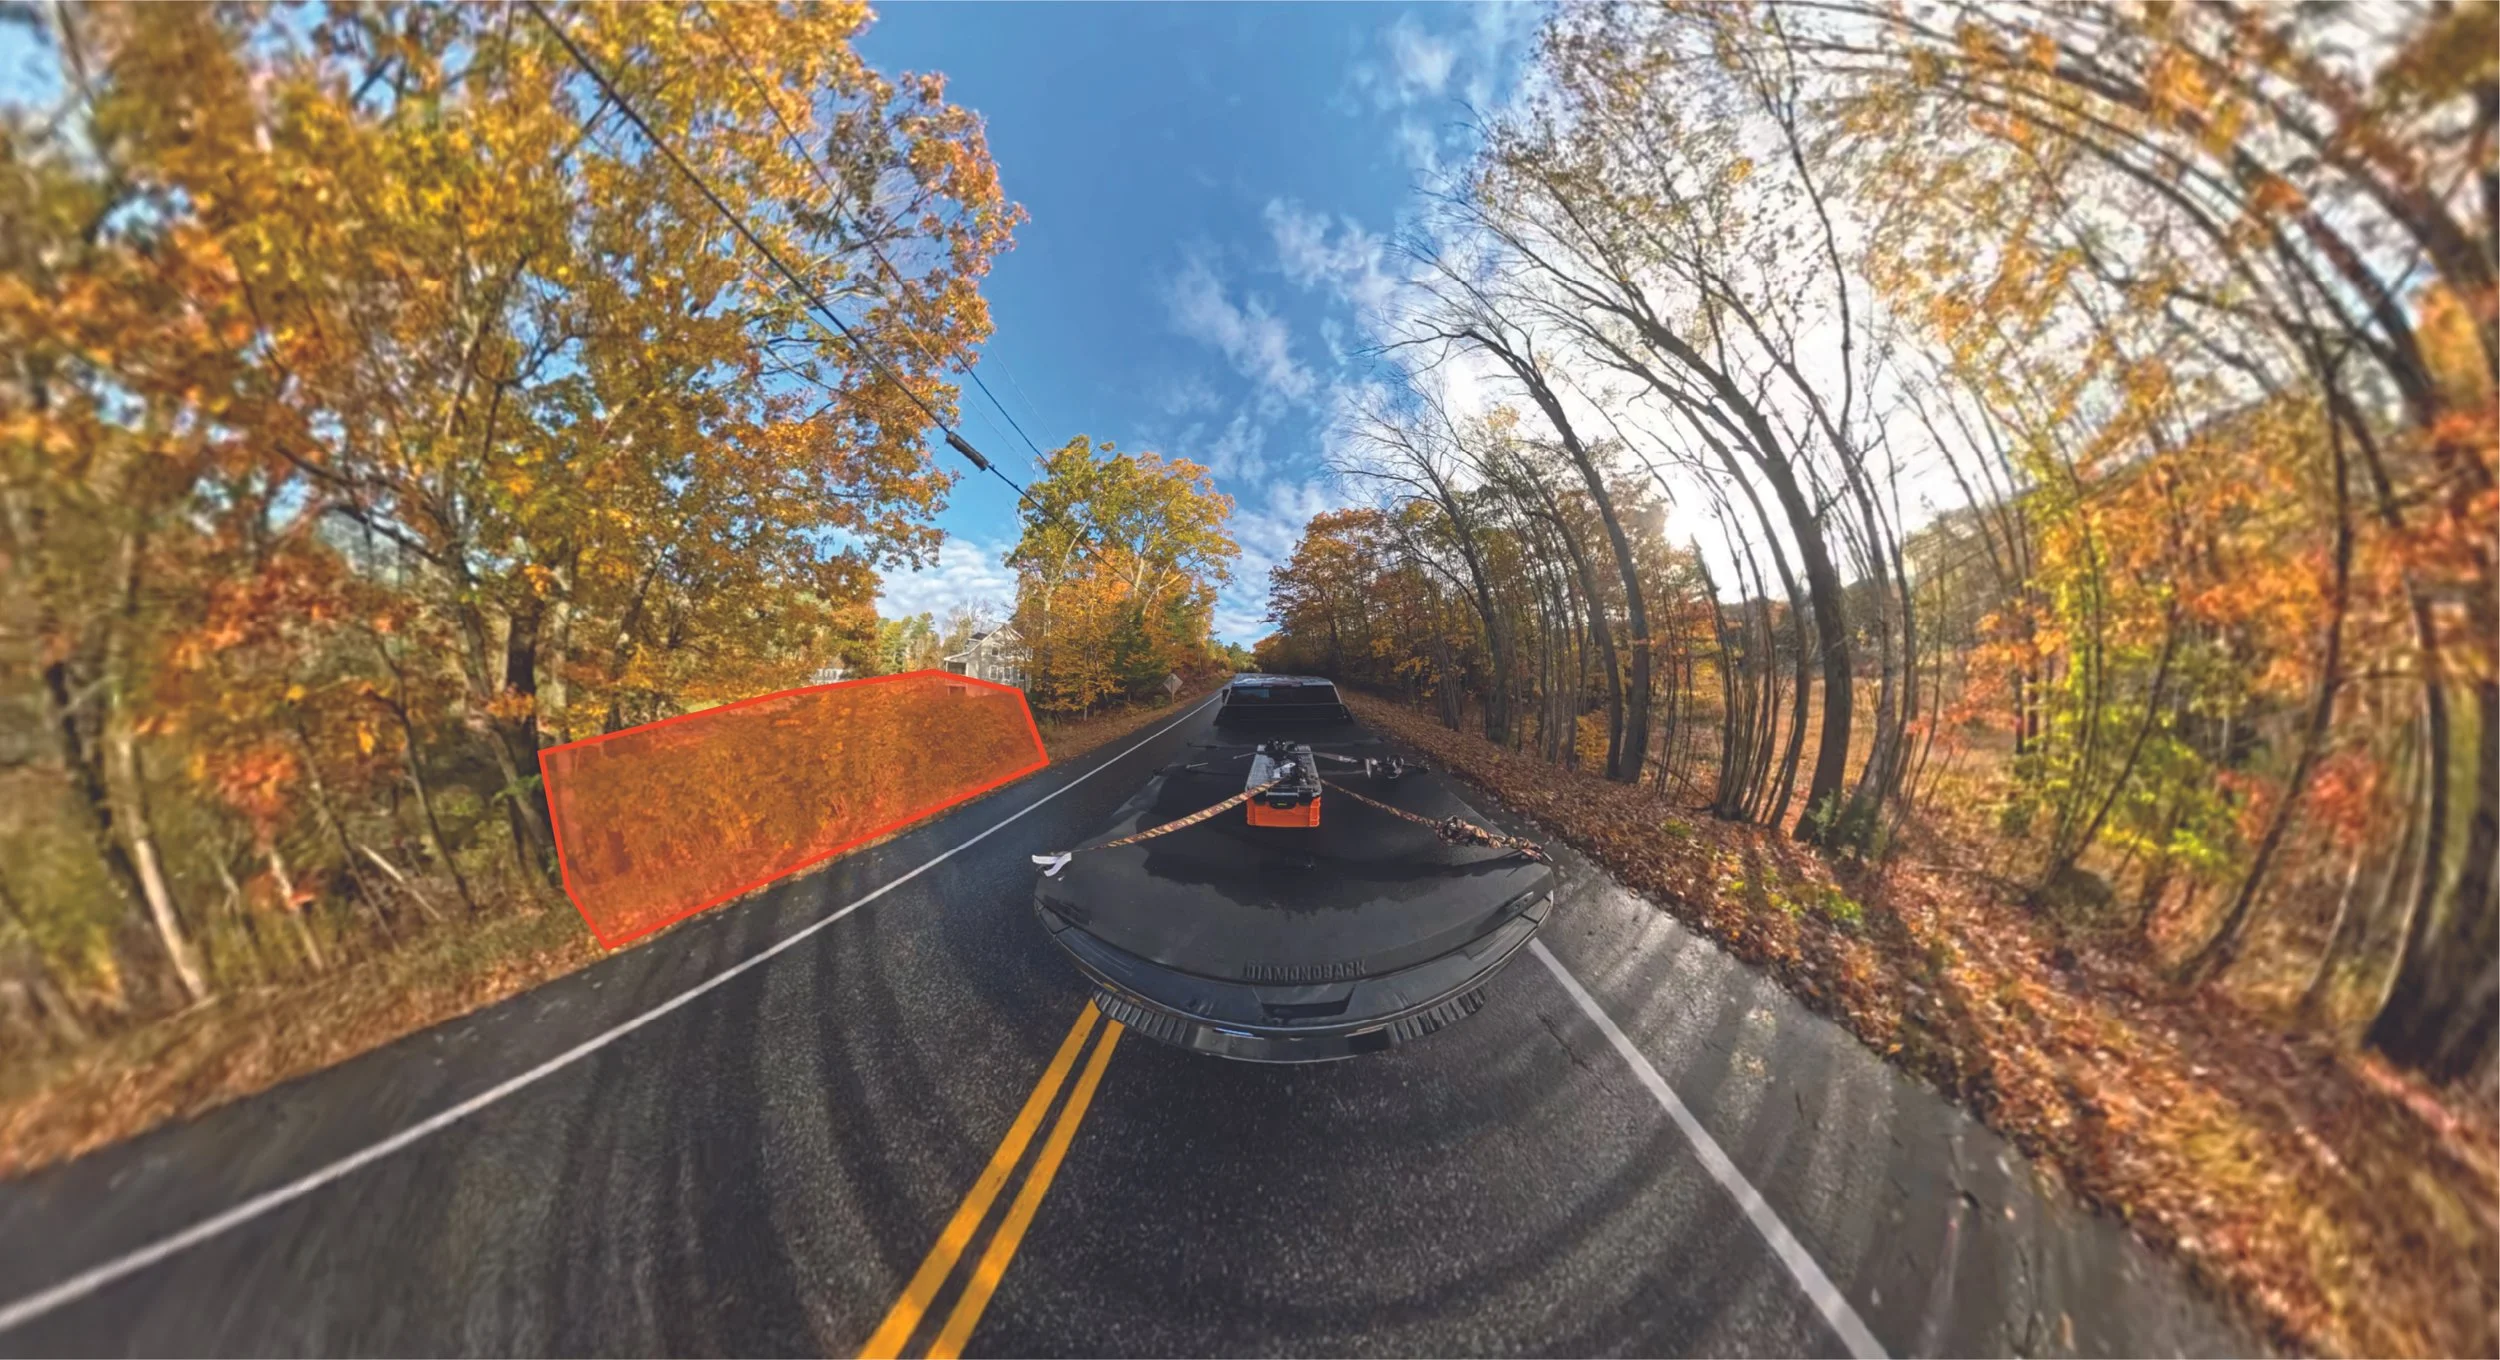
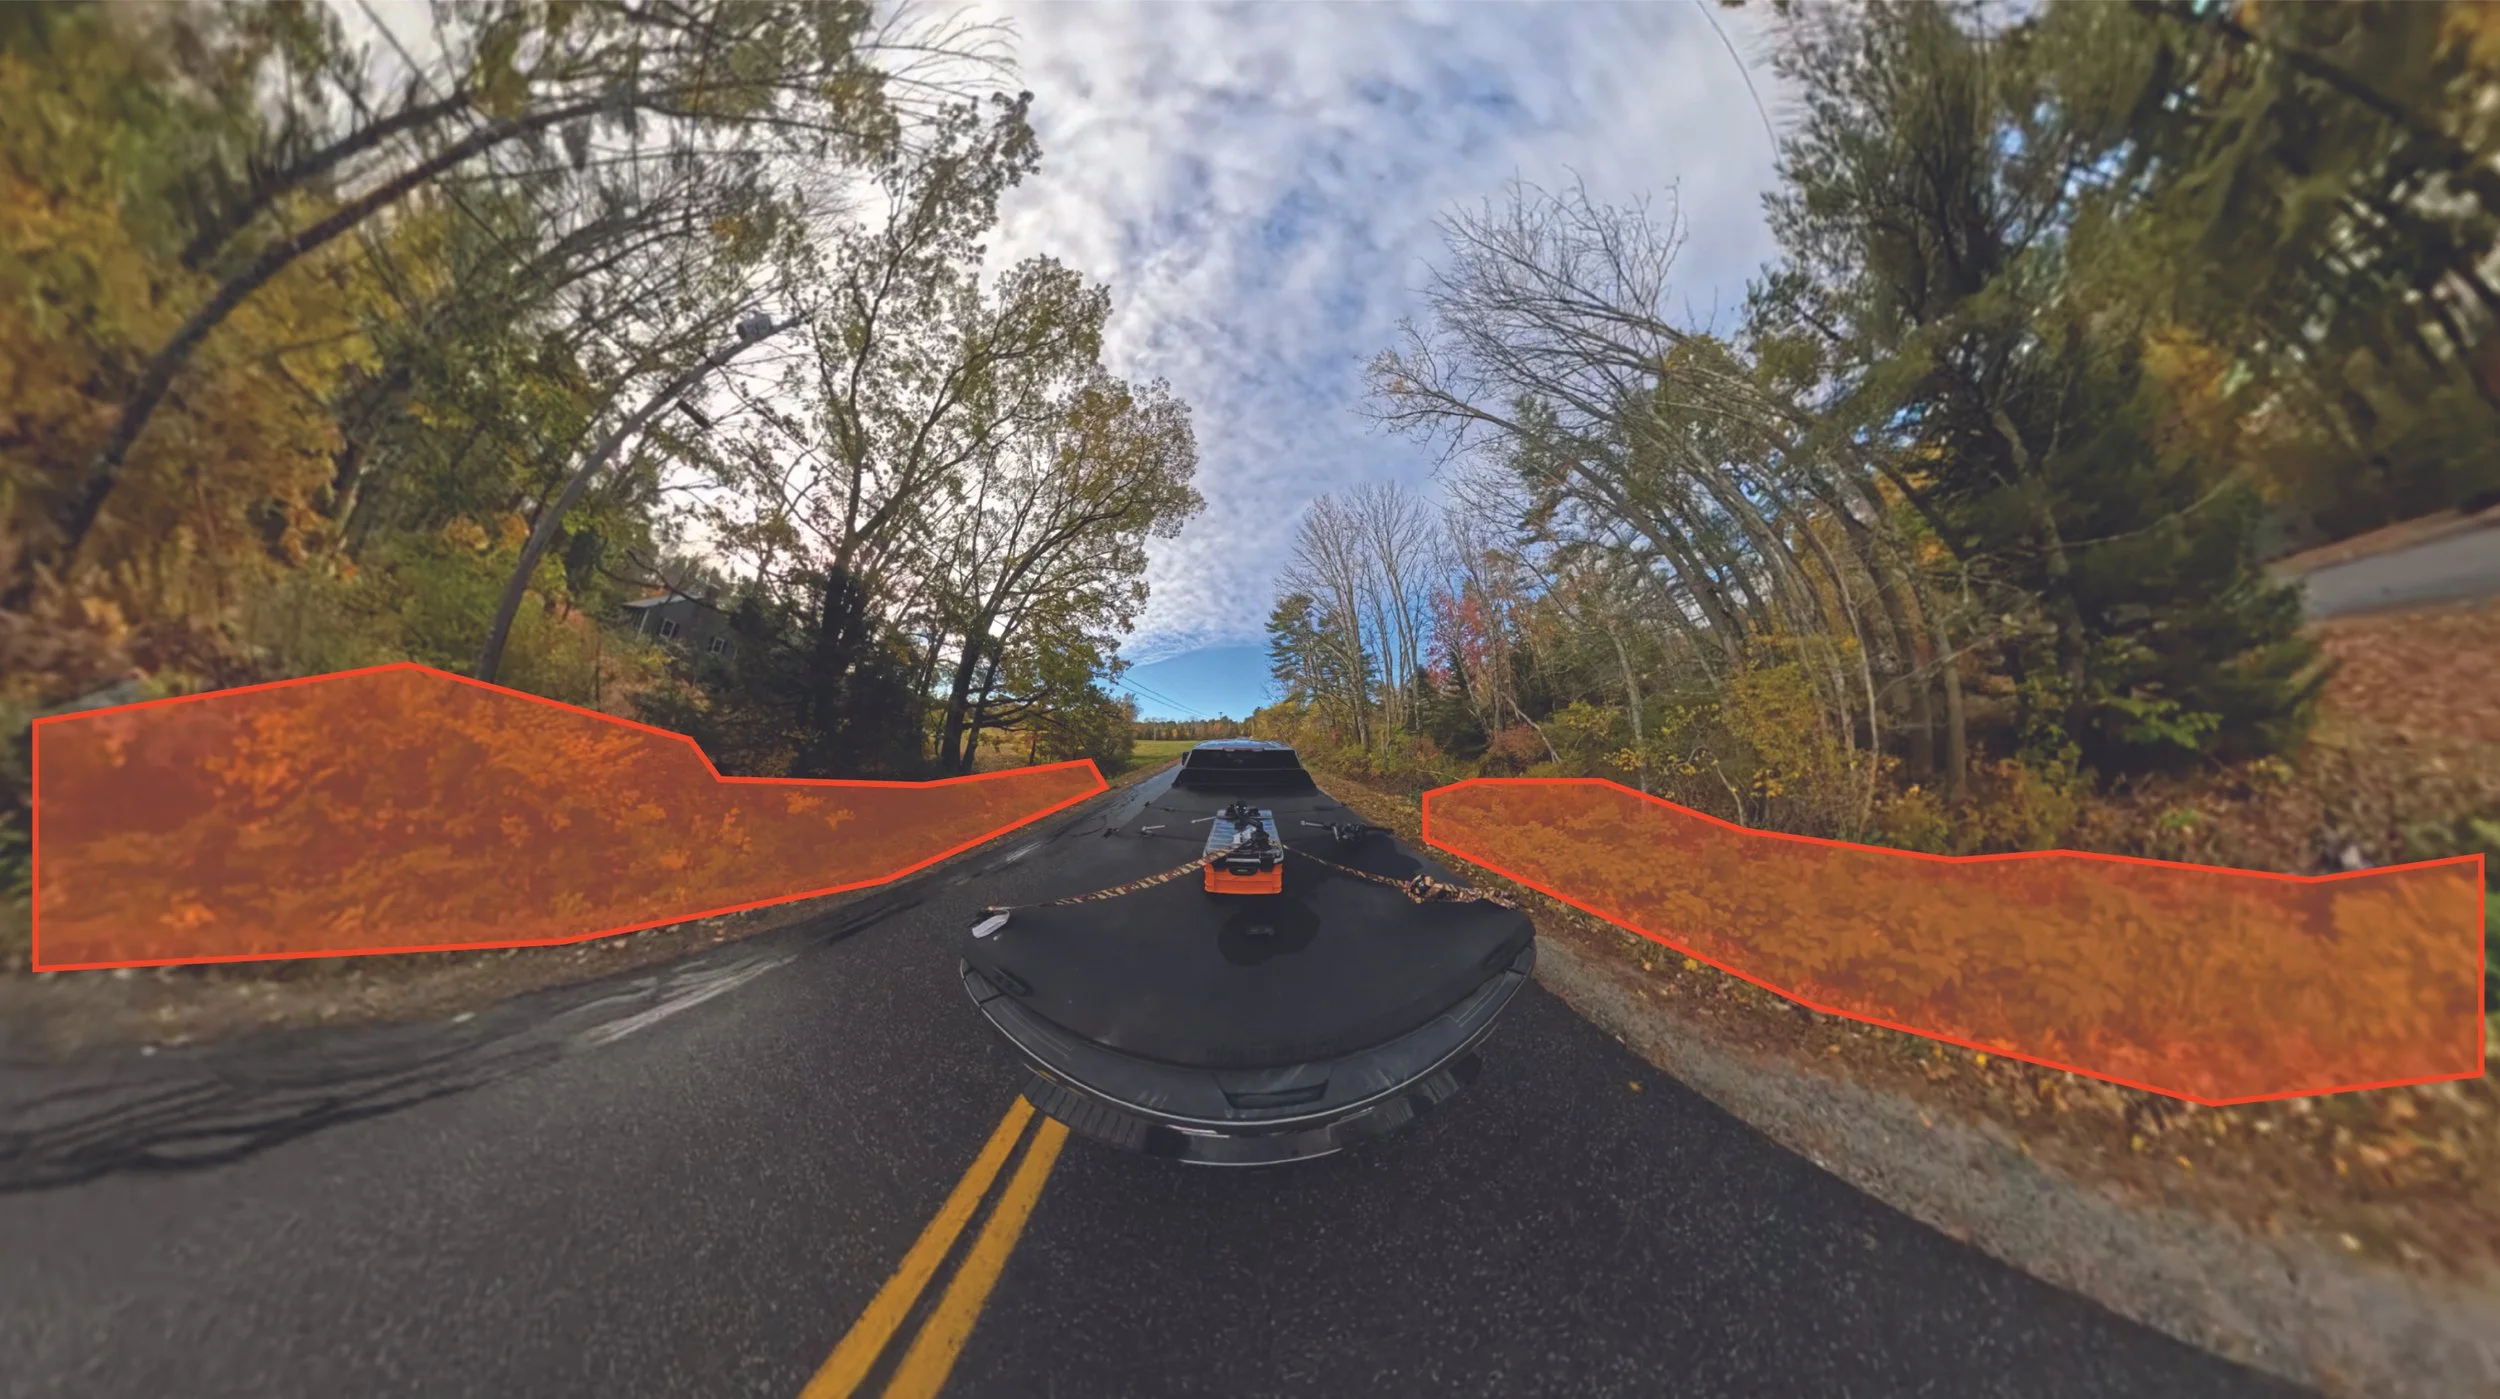
Step 3: Immersive imagery auto-uploaded to Google Street View
These location data are then used to activate a GoPro 360 recording when the user enters a geofence around the tagged infestation, automating street view imagery of infestations by driving the same paths (cam can be carried on a backpack or bike, if navigating trail systems, etc). This powers rapid response while also making real-conditions documentation easier to do.